You are here: Evaluating Data > Understanding the Graph View > Configuring Graph Variables
Configuring Graph Variables
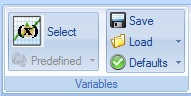
Once you have run a test and obtained accurate, reliable data, you can configure each axis to display specified variables. After opening the data file and selecting the Graph view, click the Edit tab > Variables (shown below) to further customize the data displayed on the graph.
There are four types of predefined graph layout options in TRIOS.
- TRIOS (factory) defaults: Based on procedure type (one per procedure type)
- User defaults: Based on procedure type (one per procedure type)
- Predefined: Special case
- Saved user layouts: Saved layout files which can be recalled/applied when desired
Upon initiation of an experiment, the graph layout appears based on the saved User Defaults for each procedure type, if one exists. Otherwise, the graph layout appears based on the TRIOS default layout. Once the graph is displayed, the variables can be customized using the Graph Variables dialog box.
-
NOTE: When opening a saved data file, the variable configuration will appear as originally saved, unless the option to Load view settings is unselected in the TRIOS Options > User settings.
Choosing Variables
Clicking Select opens up the Graph Variables dialog box (shown below). Follow the instructions below to specify which variables to display on each axis.
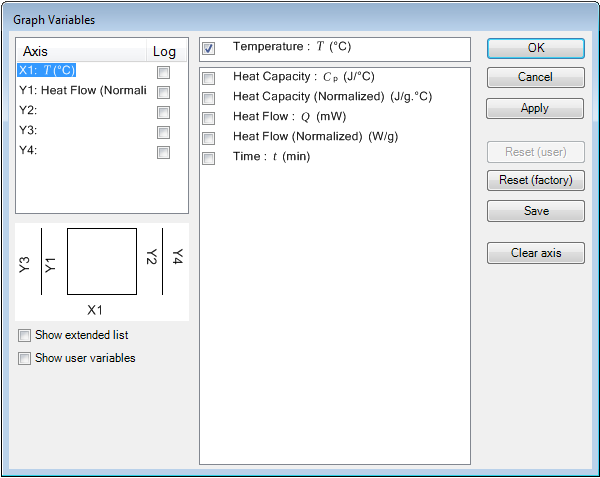
- In the left-hand pane, select the desired Axis to configure.
- If desired, click the Show extended list box and/or Show user variables to display additional variables.
- Select the desired variables by clicking the box to the left of the variable. Once checked, you can click the box again to deselect the variables. Note the following:
- The x-axis allows for one variable selection.
- The y-axis allows for multiple variable selections. Click Clear axis to clear all variable selections.
- If desired, click the following buttons to perform the described action:
- Reset (user): Restored the graph configuration to the user-saved layout for that procedure type.
- Reset factory: Restores the graph configuration to the factory defaults for the procedure type.
- Save: Saves graph configuration as the user default for that procedure type.
- Clear axis: Removes all variables from selected axis.
- Click OK to save the configuration and display the graph with the chosen variable.
Selecting Predefined Variables
Click the Predefined drop-down list to display a list of predefined variable layouts available for the displayed data. Options vary based on instrument and test type. Then clikc the desired predefined variable layout to apply the layout to the displayed data.
Saving Variables Layouts
Once the graph is displayed, the variables can be customized using the Graph Variables window. To save this layout for the procedure type, select from one of the following options from the Graph > Edit > Variable options.
- Select Default > Set Variables as User Defaults. This option replaces any previously saved User Defaults for the associated procedure type.
- Select Save to specify a name and location for the saved graph layout file. As saved layouts have the greatest utility when applied to similar data (same procedure types), it's suggested you name the saved data file accordingly for easy identification. Once saved, this layout can be reapplied in the future by selection from the Load function.
Note that the axis limits will autoscale based on input data unless manual scaling was applied on the saved graph layout.
See Also
Saving Spreadsheet Variables Layouts
Resetting Variables Layouts
To restore the graph layout to either the User Defaults or TRIOS (factory) defaults, select the appropriate option from the Graph > Edit > Variables options.
- Default > Reset Variables to User Defaults: Restores the graph configuration to the saved layout for that procedure type.
- Default > Reset Variables to Factory Defaults: Restores the graph configuration to the factory defaults for that procedure type.
Loading Saved Variables Layouts
To load a saved layout file:
- Select Load > Browse from the Graph > Edit > Variables options.
- Navigate to the saved directory location and select the file.
- Click Open. The saved graph variable settings will be applied.
- NOTE: Saved layouts have the greatest utility when applied to similar data (same procedure types); otherwise, unexpected layouts may result.
Back to top
